

I am teaching a general-education course this semester called “How Things Work”. There have been a lot of demos in class and there will be as the semester continues on. However, there are two general skills I am hoping my students will get from the class. (1) Number Sense (2) Graphing. We have spent a lot of time on both of these with mixed results. Today I would like to talk about Graphing. Check out problem 4 from the exam:

So the answers are:
(a) Solution: goes up and down while hovering at two different altitudes. Most of the people who took the test got this 100%. Average Score 4.8 / 5
(b) Solution: when the UFO jumps altitudes. The speed has to be greater than 35,000 ft/min ~ 580 ft/sec ~ .1 mile/s ~ 400 m/s ~900 mph (straight up and down and all of a sudden). The average score was 2.3 +/- 2 on this problem. Some just compared the UFO to airplanes. A number of people read the height off of the graph and wrote that as the speed. This is why it is all important to read the labels of the graph. And others tried to extract the speed from when it was just hovering.
(c) Solution: level, flat, noise. The average score was 2.9 +/- 2.4 on this problem. A lot of students tried to force or make up a trend in the data. Looking from cycle to cylce you can see the randomness of the data at the low levels indicates that this is likely noise.
(d) Solution: Following the trend it will be close to the ground And “Its a UFO so it could do anything”. 3/5 points on this problem. Lots of students got really complicated with their analysis. I don’t think many students appreicated that the graph only tells us about the data taken during the graph, nothing else. After the data is done, the UFO could go any where!
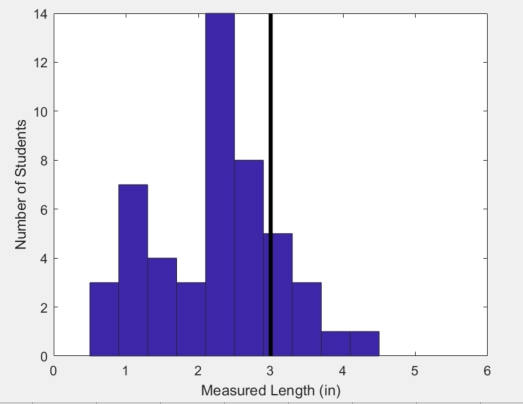
The students did pretty good with the Fermi problems and the numbersense topics. I did ask the students to sketch/draw a three in square, which I measured the length with the ruler. Here is the historgram of the results. Very interesting, some one should do a social science study on this. The average was 2.2″ and one standard deviation was about 0.8″. It is surprising that most of the guesses were lower than 3″. Everyone that drew a side of the square between 2″ and 4″ got full credit.



Leave a Reply