
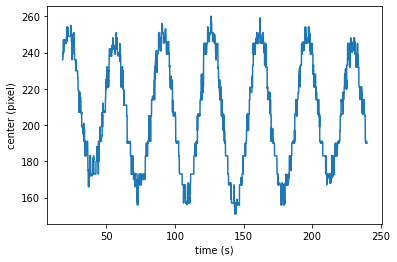
I wrote a brief script to find a center horizonatl position of laser spot as a function of time.
Step 1: Open video in python
This code shows you the first frame of the video as a bitmap. Frame is a 3D with 1D x, 1D y, and 1D RGB values.
import cv2
import numpy as np
import matplotlib.pyplot as plt

# Open Video
video_path = "IMG_1688.MP4"  # Replace with your video file path
cap     = cv2.VideoCapture(video_path)

# Get the FPS (Frames Per Second)
fps = cap.get(cv2.CAP_PROP_FPS)

while cap.isOpened():
    ret, frame = cap.read()


    plt.imshow(frame)
    plt.show

    break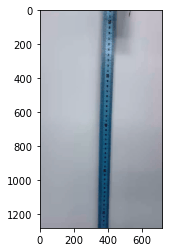
There are a couple of problems with this video. The actual data doesn’t start until 18 seconds, the frame gives us RGB and that is too much info, and there is a giant ruler in the middle. So let’s fix this up.
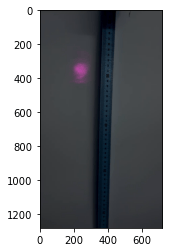
Step 2: Skipping until 18s
This is really inefficent. python has the ability to skip to a frame, and it is likely better to do that, but I am lazy here and just want to get somethign to work.
Note I got frames per second fps and created a timer tt.
import cv2
import numpy as np
import matplotlib.pyplot as plt

# Open Video
video_path = "IMG_1688.MP4"  # Replace with your video file path
cap     = cv2.VideoCapture(video_path)

# Get the FPS (Frames Per Second)
fps = cap.get(cv2.CAP_PROP_FPS)

#set start time to 18 seconds
start_time = 18

#set timers to zero
tt = 0
ii = 0
while cap.isOpened():
    ret, frame = cap.read()

    # Skip to starting point in seconda
    if tt > start_time:
        plt.imshow(frame)
        plt.show

        break

    #update time
    ii = ii + 1
    tt = ii / fps
Step 3: Greyscale
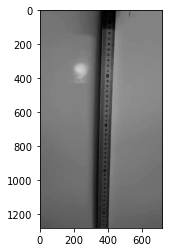
I got rid of the RGB and turned this into a 2D array with grayscale. Here is the part of the code that matters:
    # Skip to starting point in seconda
    if tt > start_time:

        # Get Gray Frame
        gray_frame = cv2.cvtColor(frame, cv2.COLOR_BGR2GRAY)


        plt.imshow(gray_frame, cmap="gray")
        plt.show
Step 4: Mask your data
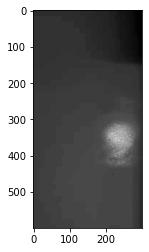
I only use a grid of 600 X 300 pixels, cuting the rest out.
    # Skip to starting point in seconda
    if tt > start_time:

        # Get Gray Frame
        gray_frame = cv2.cvtColor(frame, cv2.COLOR_BGR2GRAY)

        # Cut out ruler
        data = gray_frame[0:600, 0:300]

        plt.imshow(data, cmap="gray")
        plt.show

        break
Step 5: 1D compression.
I might consider a 2D guassian fit here. But in order to keep this as simple as possible, let’s just do a 1D fit in the x-direction. So do this, we are going to intergrate along the y-direction:
    # Skip to starting point in seconda
    if tt > start_time:

        # Get Gray Frame
        gray_frame = cv2.cvtColor(frame, cv2.COLOR_BGR2GRAY)

        # Cut out ruler
        data = gray_frame[0:600, 0:300]

        # plt.imshow(data, cmap="gray")
        # plt.show

        ff = np.sum(data, axis=0)
        xx = np.arange(len(ff))

        plt.plot(xx,ff)
        plt.xlabel("x (pixels)")
        plt.ylabel('count')


        break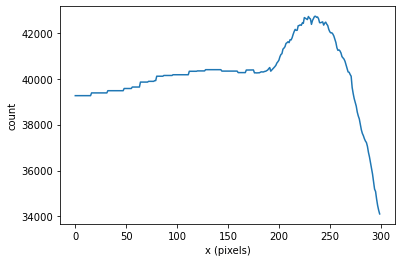
Step 6: Finding the center.
Okay, here is what I want to do, get a pulse without the laser there and subtract from this image. This will accound for whatever is happening to the light level at 300 pixels. (likely this is due to the ruler. I didn’t have much space.) Then I would fit a 1d Gaussian to the curve. Here is what happens when I try this now with out the background.
So I had to add a new library and define the fit function so this is the entire thing.
import cv2
import numpy as np
import matplotlib.pyplot as plt
from scipy.optimize import curve_fit

# Open Video
video_path = "IMG_1688.MP4"  # Replace with your video file path
cap     = cv2.VideoCapture(video_path)

#Define Gaussian Function
def MyGaussian(x, offset, amplitude, mean, std_dev):
    return offset + amplitude * np.exp(-1*((x - mean)**2) / (2 * std_dev**2))


# Get the FPS (Frames Per Second)
fps = cap.get(cv2.CAP_PROP_FPS)

#set start time to 18 seconds
start_time = 18


#set timers to zero
tt = 0
ii = 0
while cap.isOpened():
    ret, frame = cap.read()

    # Skip to starting point in seconda
    if tt > start_time:

        # Get Gray Frame
        gray_frame = cv2.cvtColor(frame, cv2.COLOR_BGR2GRAY)

        # Cut out ruler
        data = gray_frame[0:600, 0:300]

        # plt.imshow(data, cmap="gray")
        # plt.show

        ff = np.sum(data, axis=0)
        xx = np.arange(len(ff))

        plt.plot(xx,ff)
        plt.xlabel("x (pixels)")
        plt.ylabel('count')

        initial_guesses = [40000, 2000, 250, 30]
        # Perform the curve fit
        popt, pcov = curve_fit(MyGaussian, xx, ff, p0=initial_guesses)

        plt.plot(xx,MyGaussian(xx,popt[0], popt[1], popt[2], popt[3]),'--r')


        break

    #update time
    ii = ii + 1
    tt = ii / fps
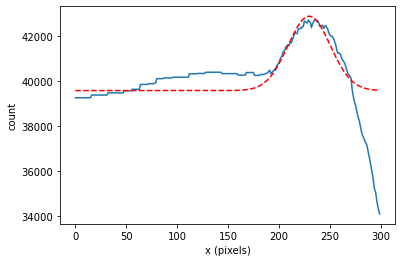
Not perfect, but a pretty good fit, but a good estimation of the peak. To get the center position you would use popt[2]
Another you want to try is the argmax function. There is no fit, it just finds the index of the max value. Here the function seems smooth so likely ok, but the fit is better.
    # Skip to starting point in seconda
    if tt > start_time:

        # Get Gray Frame
        gray_frame = cv2.cvtColor(frame, cv2.COLOR_BGR2GRAY)

        # Cut out ruler
        data = gray_frame[0:600, 0:300]

        # plt.imshow(data, cmap="gray")
        # plt.show

        ff = np.sum(data, axis=0)
        center = np.argmax(ff)

        break
Step 7: Store Data
We want to create containers to store the data. So at the top of the code you need. This creates a box for position and time of the laser.
# Set Starting Time and Ending Time
start_time = 18
end_time = 240
FrameCount = (end_time-start_time)*fps
FrameCount = int(FrameCount)  #Convert to Int

# Prepare Data Containers
jj = 0
Time     = np.zeros(FrameCount)
CenterPt = np.zeros(FrameCount)
Down in the loop you need:
    # Skip to starting point in seconda
    if tt > start_time:

        # Get Gray Frame
        gray_frame = cv2.cvtColor(frame, cv2.COLOR_BGR2GRAY)

        # Cut out ruler
        data = gray_frame[0:600, 0:300]

        # plt.imshow(data, cmap="gray")
        # plt.show

        ff = np.sum(data, axis=0)
        center = np.argmax(ff)

        Time[jj]      = tt
        CenterPt[jj]  = center
        jj            = jj + 1

        break
If you use the gaussian approach you use popt[2] instead of center.
Step 8: Run it
This is great but now you need to remove the break point out of the if statement, because you want to look at more than one time.
We will also need to make sure we don’t go past the end framecount, so we will check as we loop through. When we get to the end, we will exit the while loop.
import cv2
import numpy as np
import matplotlib.pyplot as plt
from scipy.optimize import curve_fit

# Open Video
video_path = "IMG_1688.MP4"  # Replace with your video file path
cap     = cv2.VideoCapture(video_path)

#Define Gaussian Function
def MyGaussian(x, offset, amplitude, mean, std_dev):
    return offset + amplitude * np.exp(-1*((x - mean)**2) / (2 * std_dev**2))


# Get the FPS (Frames Per Second)
fps = cap.get(cv2.CAP_PROP_FPS)

# Set Starting Time and Ending Time
start_time = 18
end_time = 240
FrameCount = (end_time-start_time)*fps
FrameCount = int(FrameCount)  #Convert to Int

# Prepare Data Containers
jj = 0
Time     = np.zeros(FrameCount)
CenterPt = np.zeros(FrameCount)


#set timers to zero
tt = 0
ii = 0
while cap.isOpened():
    ret, frame = cap.read()

    # Skip to starting point in seconda
    if tt > start_time:

        # Get Gray Frame
        gray_frame = cv2.cvtColor(frame, cv2.COLOR_BGR2GRAY)

        # Cut out ruler
        data = gray_frame[0:600, 0:300]

        # plt.imshow(data, cmap="gray")
        # plt.show

        ff = np.sum(data, axis=0)
        center = np.argmax(ff)

        Time[jj]      = tt
        CenterPt[jj]  = center
        jj            = jj + 1

    #End the process at this time in seconds
    if jj == FrameCount:
        break

    #update time
    ii = ii + 1
    tt = ii / fps


plt.plot(Time, CenterPt)
plt.xlabel("time (s)")
plt.ylabel("center (pixel)")



Leave a Reply